In order to try the new column visuals, you do not need to use any code, no PCF Controls or PowerBI, just identifying the column visuals for the right use case. So what is it that Microsoft actually launched, for type of visuals:
- Radial Dial
- Line Chart
- Heat Map
- Star Rating
Microsoft has shared the following table when it comes to the purpose and best fit column data (Link to Microsoft source: here)
| Visualization | Name | What it shows | Best-fit column data |
|---|---|---|---|
 | Radial Dial | A circular gauge filled to a percentage, with the value shown in the center. | A single number on a 0–100 scale (a percentage). More information: Radial dial |
 | Line Chart | A small trend line (sparkline) across several points. | A text column holding several numbers separated by commas. More information: Line chart |
 | Heat Map | A horizontal bar whose color changes with the value (for example green → amber → red). | A single number within a defined range (0–100 by default). More information: Heat map |
 | Star Rating | A row of stars filled to match the value. | A whole number from 0 up to the number of stars (0–5 by default). More information: Star rating |
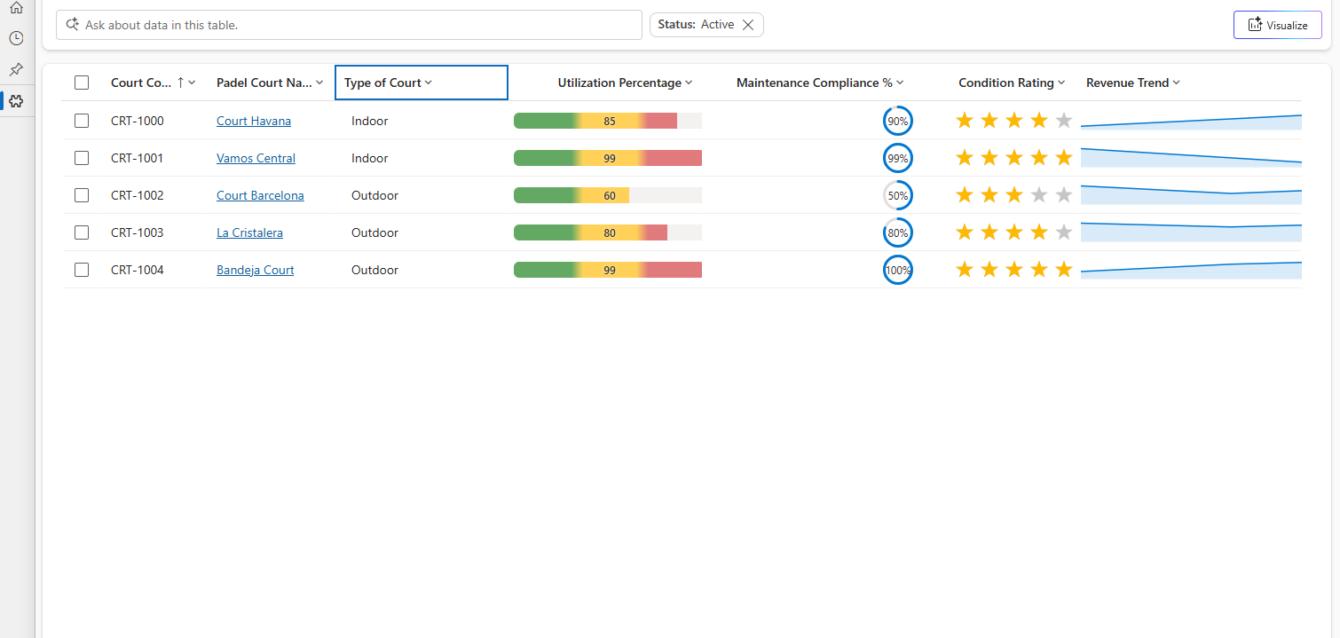
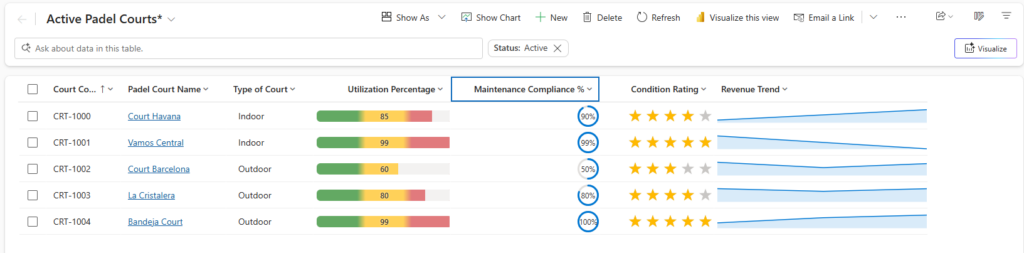
For Padel Vamos I have made an enhancement for when it comes to managing courts.
| Display | Data Type | Visual | Notes |
|---|---|---|---|
| Court Name | Text | – | |
| Utilization % | Whole Number (0–100) | Heat Map | Manually set, or driven by a nightly flow summing bookings |
| Revenue Trend | Text (single line, ~200 chars) | Line Chart | Comma-separated, e.g. 4200,4650,3900,5100,... — last 3 months. Populate via flow appending month-end totals |
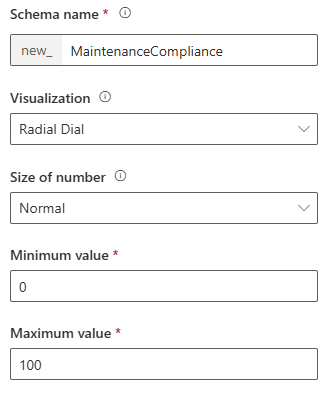
| Maintenance Compliance % | Whole Number (0–100) | Radial Dial | % of scheduled maintenance tasks completed this quarter |
| Condition Rating | Whole Number (1–5) | Star Rating | Rates from Padel Players via Survey |
The new column visuals are great and I like the ability to make “static grids” more enhanced and colorful. The odd one from the list is probably the Line Chart, in my example the Revenue Trend. This one requires it to be string and comma seperated which means you do need to do extra data transformation to get it in this step. It would not allow it to be Power FX.
How to configure the new column visuals?
When configuring your column, either creating it new or updating it, you now have the ability to connect one of the new column visuals to it. Publish you table and your grid is ready, simple as that